Code
import os
os.system('pip3 install great_tables')0Code
os.system('pip3 install pandas')0Posit conf 2024 Link:
https://reg.conf.posit.co/flow/posit/positconf24/publiccatalog/page/publiccatalog?tab.day=20240813
video:https://www.youtube.com/@PositPBC/videos
Talk by Sean Nguyen
using quarto parameters to make multiple quarto output
Talk by Allen Downey
video:https://www.youtube.com/watch?v=YKMZIzYBgTk
Talk by Tyler Morgan-Wall
video:https://www.youtube.com/watch?v=U8_Dc_ru8fg
Talk by Joshua J. Cook
{{< include _data.qmd >}}
this is _data.qmd
import os
os.system('pip3 install great_tables')0os.system('pip3 install pandas')0import great_tables as gt
from great_tables.data import sp500
print(sp500.head()) date open high ... close volume adj_close
0 2015-12-31 2060.5901 2062.5400 ... 2043.9399 2.655330e+09 2043.9399
1 2015-12-30 2077.3401 2077.3401 ... 2063.3601 2.367430e+09 2063.3601
2 2015-12-29 2060.5400 2081.5601 ... 2078.3601 2.542000e+09 2078.3601
3 2015-12-28 2057.7700 2057.7700 ... 2056.5000 2.492510e+09 2056.5000
4 2015-12-24 2063.5200 2067.3601 ... 2060.9900 1.411860e+09 2060.9900
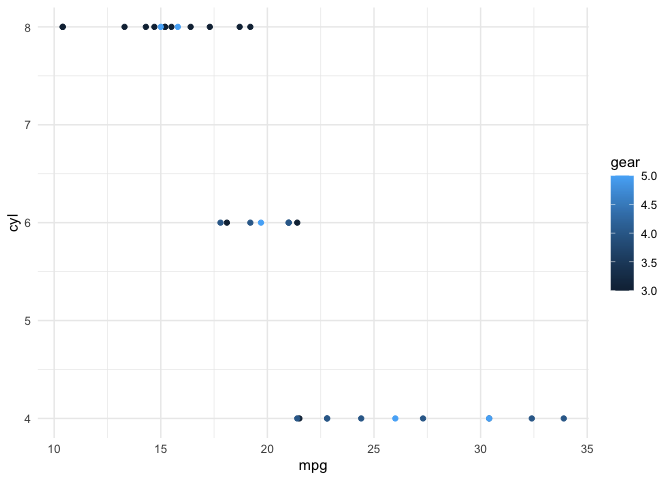
[5 rows x 7 columns]embed other code result into this quarto doc(only result).
{{< embed _penguins.qmd#fig-size-scatter >}}
video:https://www.youtube.com/watch?v=PITfti4JRiU
https://quarto.org/docs/authoring/notebook-embed.html
https://quarto.org/docs/authoring/includes.html
Talk by Orla Doyle
video:https://www.youtube.com/watch?v=HoTl0oYUX3c
Talk by Christoph Scheuch
#install.packages("tidyfinance")library(tidyverse)
library(tidyfinance)
library(scales)prices <- download_data(
type = "stock_prices",
symbols = "AAPL",
start_date = "2000-01-01",
end_date = "2025-12-31"
) |> arrange(desc(date))head(prices)# A tibble: 6 × 8
symbol date volume open low high close adjusted_close
<chr> <date> <dbl> <dbl> <dbl> <dbl> <dbl> <dbl>
1 AAPL 2024-11-04 44903300 221. 220. 223. 222. 222.
2 AAPL 2024-11-01 65276700 221. 220. 225. 223. 223.
3 AAPL 2024-10-31 64370100 229. 225. 230. 226. 226.
4 AAPL 2024-10-30 47070900 233. 230. 233. 230. 230.
5 AAPL 2024-10-29 35417200 233. 232. 234. 234. 234.
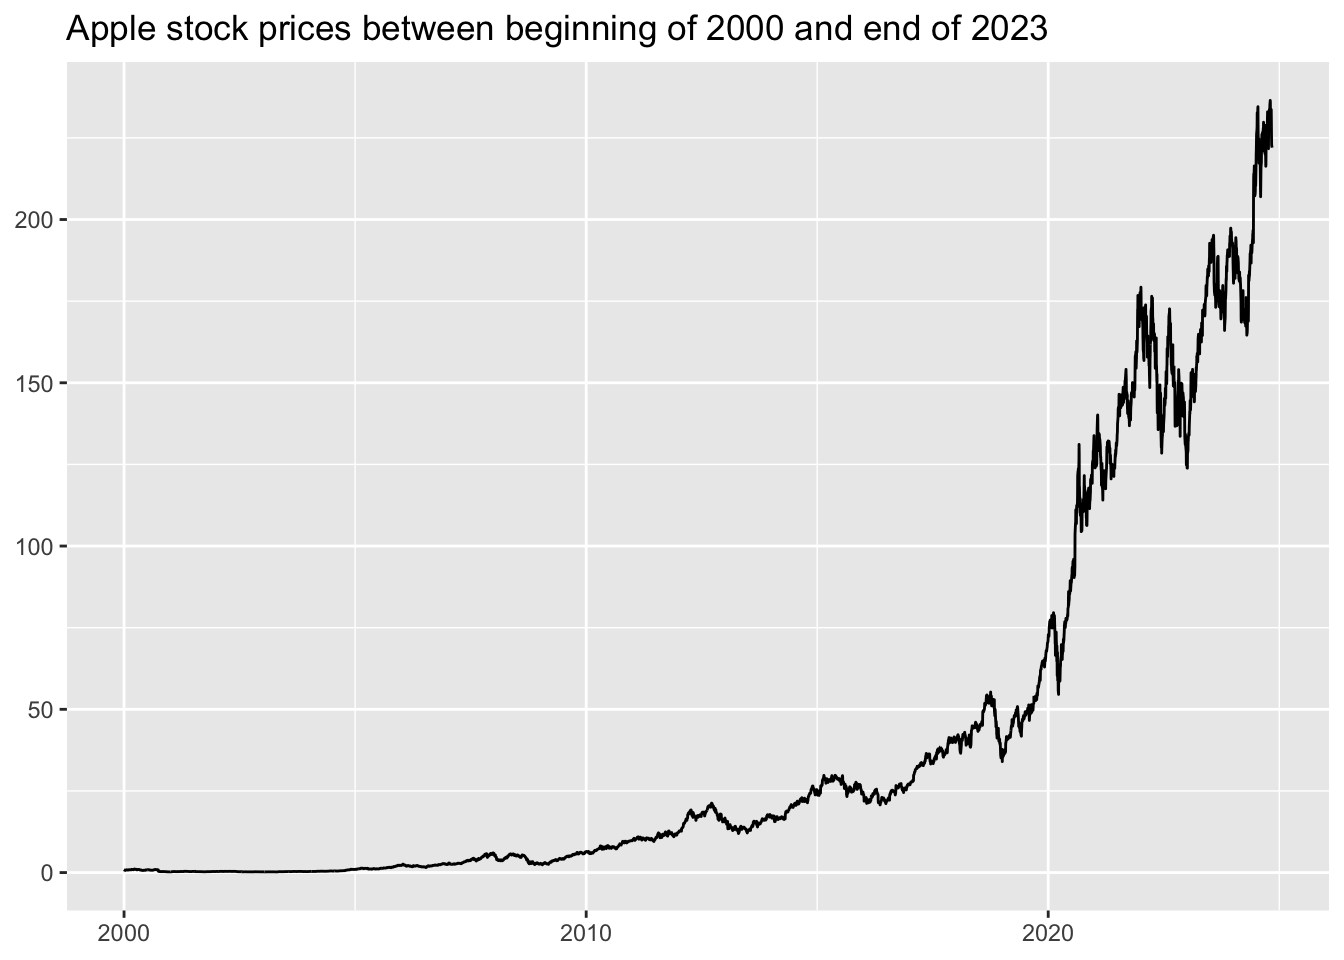
6 AAPL 2024-10-28 36087100 233. 233. 235. 233. 233.prices |>
ggplot(aes(x = date, y = adjusted_close)) +
geom_line() +
labs(
x = NULL,
y = NULL,
title = "Apple stock prices between beginning of 2000 and end of 2023"
)
import os
#os.system('pip3 install yfinance')
#os.system('pip3 install plotnine')
#os.system('pip3 install seaborn')
#os.system('pip3 install siuba')import pandas as pd
import numpy as np
import yfinance as yf
#from siuba import *# prices = (yf.download(
# tickers="AAPL",
# start="2000-01-01",
# end="2025-12-31",
# )
prices= yf.Ticker("AAPL").history(start="2000-01-01", end="2025-12-31")
prices = prices.reset_index()prices.head() Date Open ... Dividends Stock Splits
0 2000-01-03 00:00:00-05:00 0.790753 ... 0.0 0.0
1 2000-01-04 00:00:00-05:00 0.816200 ... 0.0 0.0
2 2000-01-05 00:00:00-05:00 0.782270 ... 0.0 0.0
3 2000-01-06 00:00:00-05:00 0.800178 ... 0.0 0.0
4 2000-01-07 00:00:00-05:00 0.727606 ... 0.0 0.0
[5 rows x 8 columns]prices.info()<class 'pandas.core.frame.DataFrame'>
RangeIndex: 6250 entries, 0 to 6249
Data columns (total 8 columns):
# Column Non-Null Count Dtype
--- ------ -------------- -----
0 Date 6250 non-null datetime64[ns, America/New_York]
1 Open 6250 non-null float64
2 High 6250 non-null float64
3 Low 6250 non-null float64
4 Close 6250 non-null float64
5 Volume 6250 non-null int64
6 Dividends 6250 non-null float64
7 Stock Splits 6250 non-null float64
dtypes: datetime64[ns, America/New_York](1), float64(6), int64(1)
memory usage: 390.8 KBprices.tail().round(3) Date Open ... Dividends Stock Splits
6245 2024-10-29 00:00:00-04:00 233.10 ... 0.0 0.0
6246 2024-10-30 00:00:00-04:00 232.61 ... 0.0 0.0
6247 2024-10-31 00:00:00-04:00 229.34 ... 0.0 0.0
6248 2024-11-01 00:00:00-04:00 220.97 ... 0.0 0.0
6249 2024-11-04 00:00:00-05:00 220.99 ... 0.0 0.0
[5 rows x 8 columns]from plotnine import *
prices_figure = (
ggplot(prices,
aes(y="Close", x="Date")) +
geom_line() +
labs(x="", y="",
title="Apple stock prices from 2000 to 2023")
)print(prices_figure)<ggplot: (640 x 480)>import seaborn as sns
sns.lineplot(data=prices,x='Date',y='Close')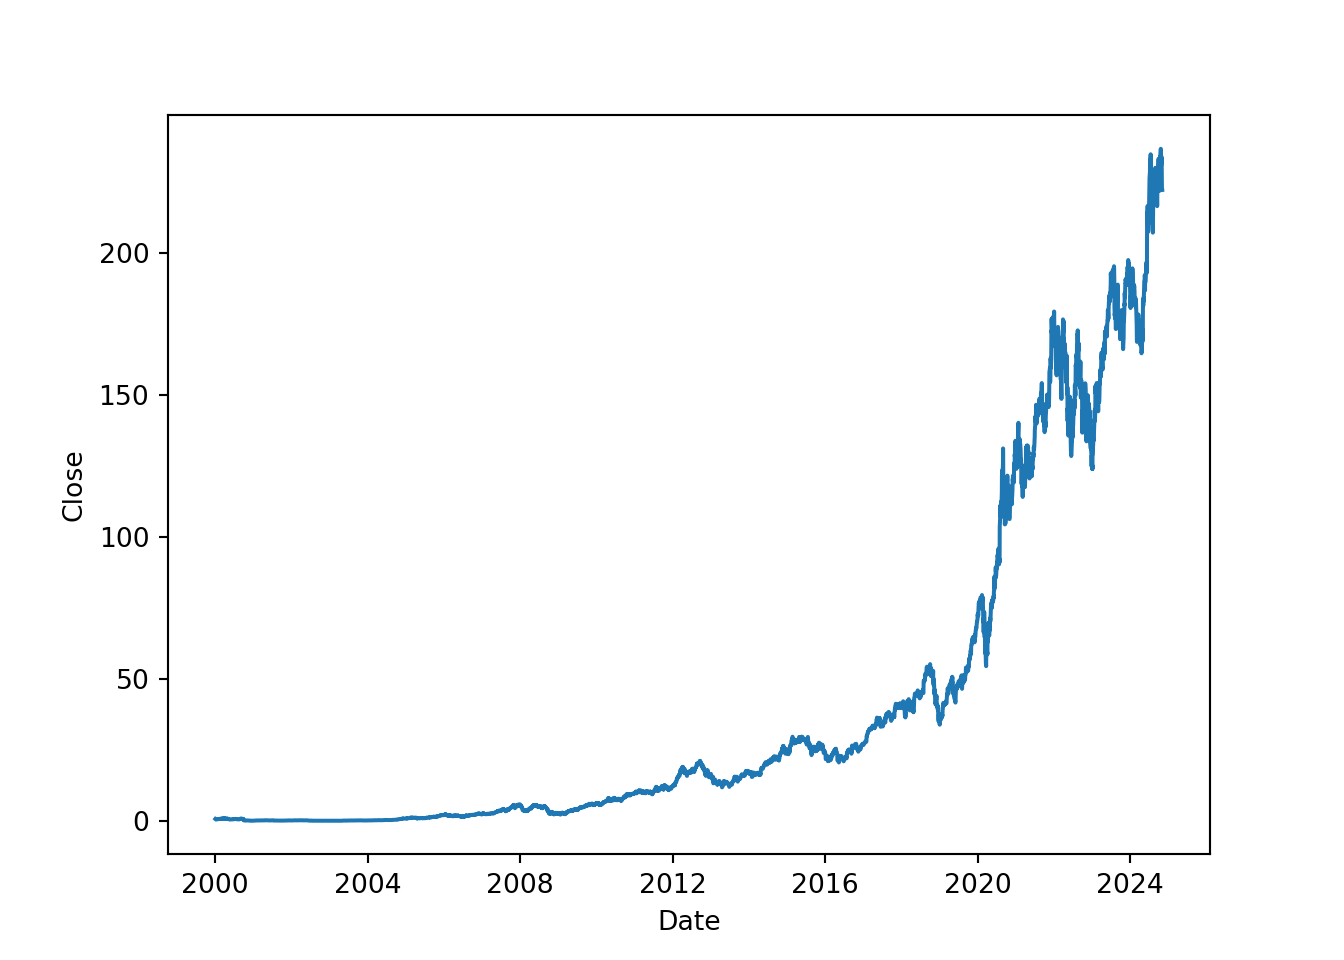
video:https://www.youtube.com/watch?v=vV7JECvFXNE
tidy finance book:https://www.tidy-finance.org/
https://www.youtube.com/watch?v=1gUl-vWqScc
# https://github.com/redivis/redivis-r
#install.packages("devtools")
#install.packages('sf')
#install.packages('arrow')
#devtools::install_github("redivis/redivis-r", ref="main")

library(redivis)

user <- redivis::user("datapages")
dataset <- user$dataset("palmerpenguins:9g3v:v1_0")
table <- dataset$table("penguins:79km")

# Load table as tidyverse tibble
data <- table$to_tibble(max_results=100)
head(data)first remove renv in the project renv::deactivate()
page:https://tonyfly3000.github.io/datapage_example/ code:https://github.com/TonyFly3000/datapage_example
data.qmd{{< redivis-table >}}
<!-- {{< redivis-table verykoala.penguinsdata.penguins >}} -->_quarto.ymlproject:
title: "Penguins datapage example"
type: datapage
output-dir: docs
redivis:
user: verykoala
dataset: penguinsdata
table: penguins.RenvironREDIVIS_API_TOKEN=xxxxxxx
video :https://www.youtube.com/watch?v=1gUl-vWqScc
datapage github page: https://github.com/datapages/datapage
data page excample :https://datapages.github.io/datapage/
video:https://www.youtube.com/watch?v=AP8BWGhCRZc
link:https://reg.conf.posit.co/flow/posit/positconf24/publiccatalog/page/publiccatalog/session/1712004520449001rbm2
link:https://reg.conf.posit.co/flow/posit/positconf24/publiccatalog/page/publiccatalog/session/1712707493462001KPj8
https://reg.conf.posit.co/flow/posit/positconf24/publiccatalog/page/publiccatalog/session/1712707493462001KPj8
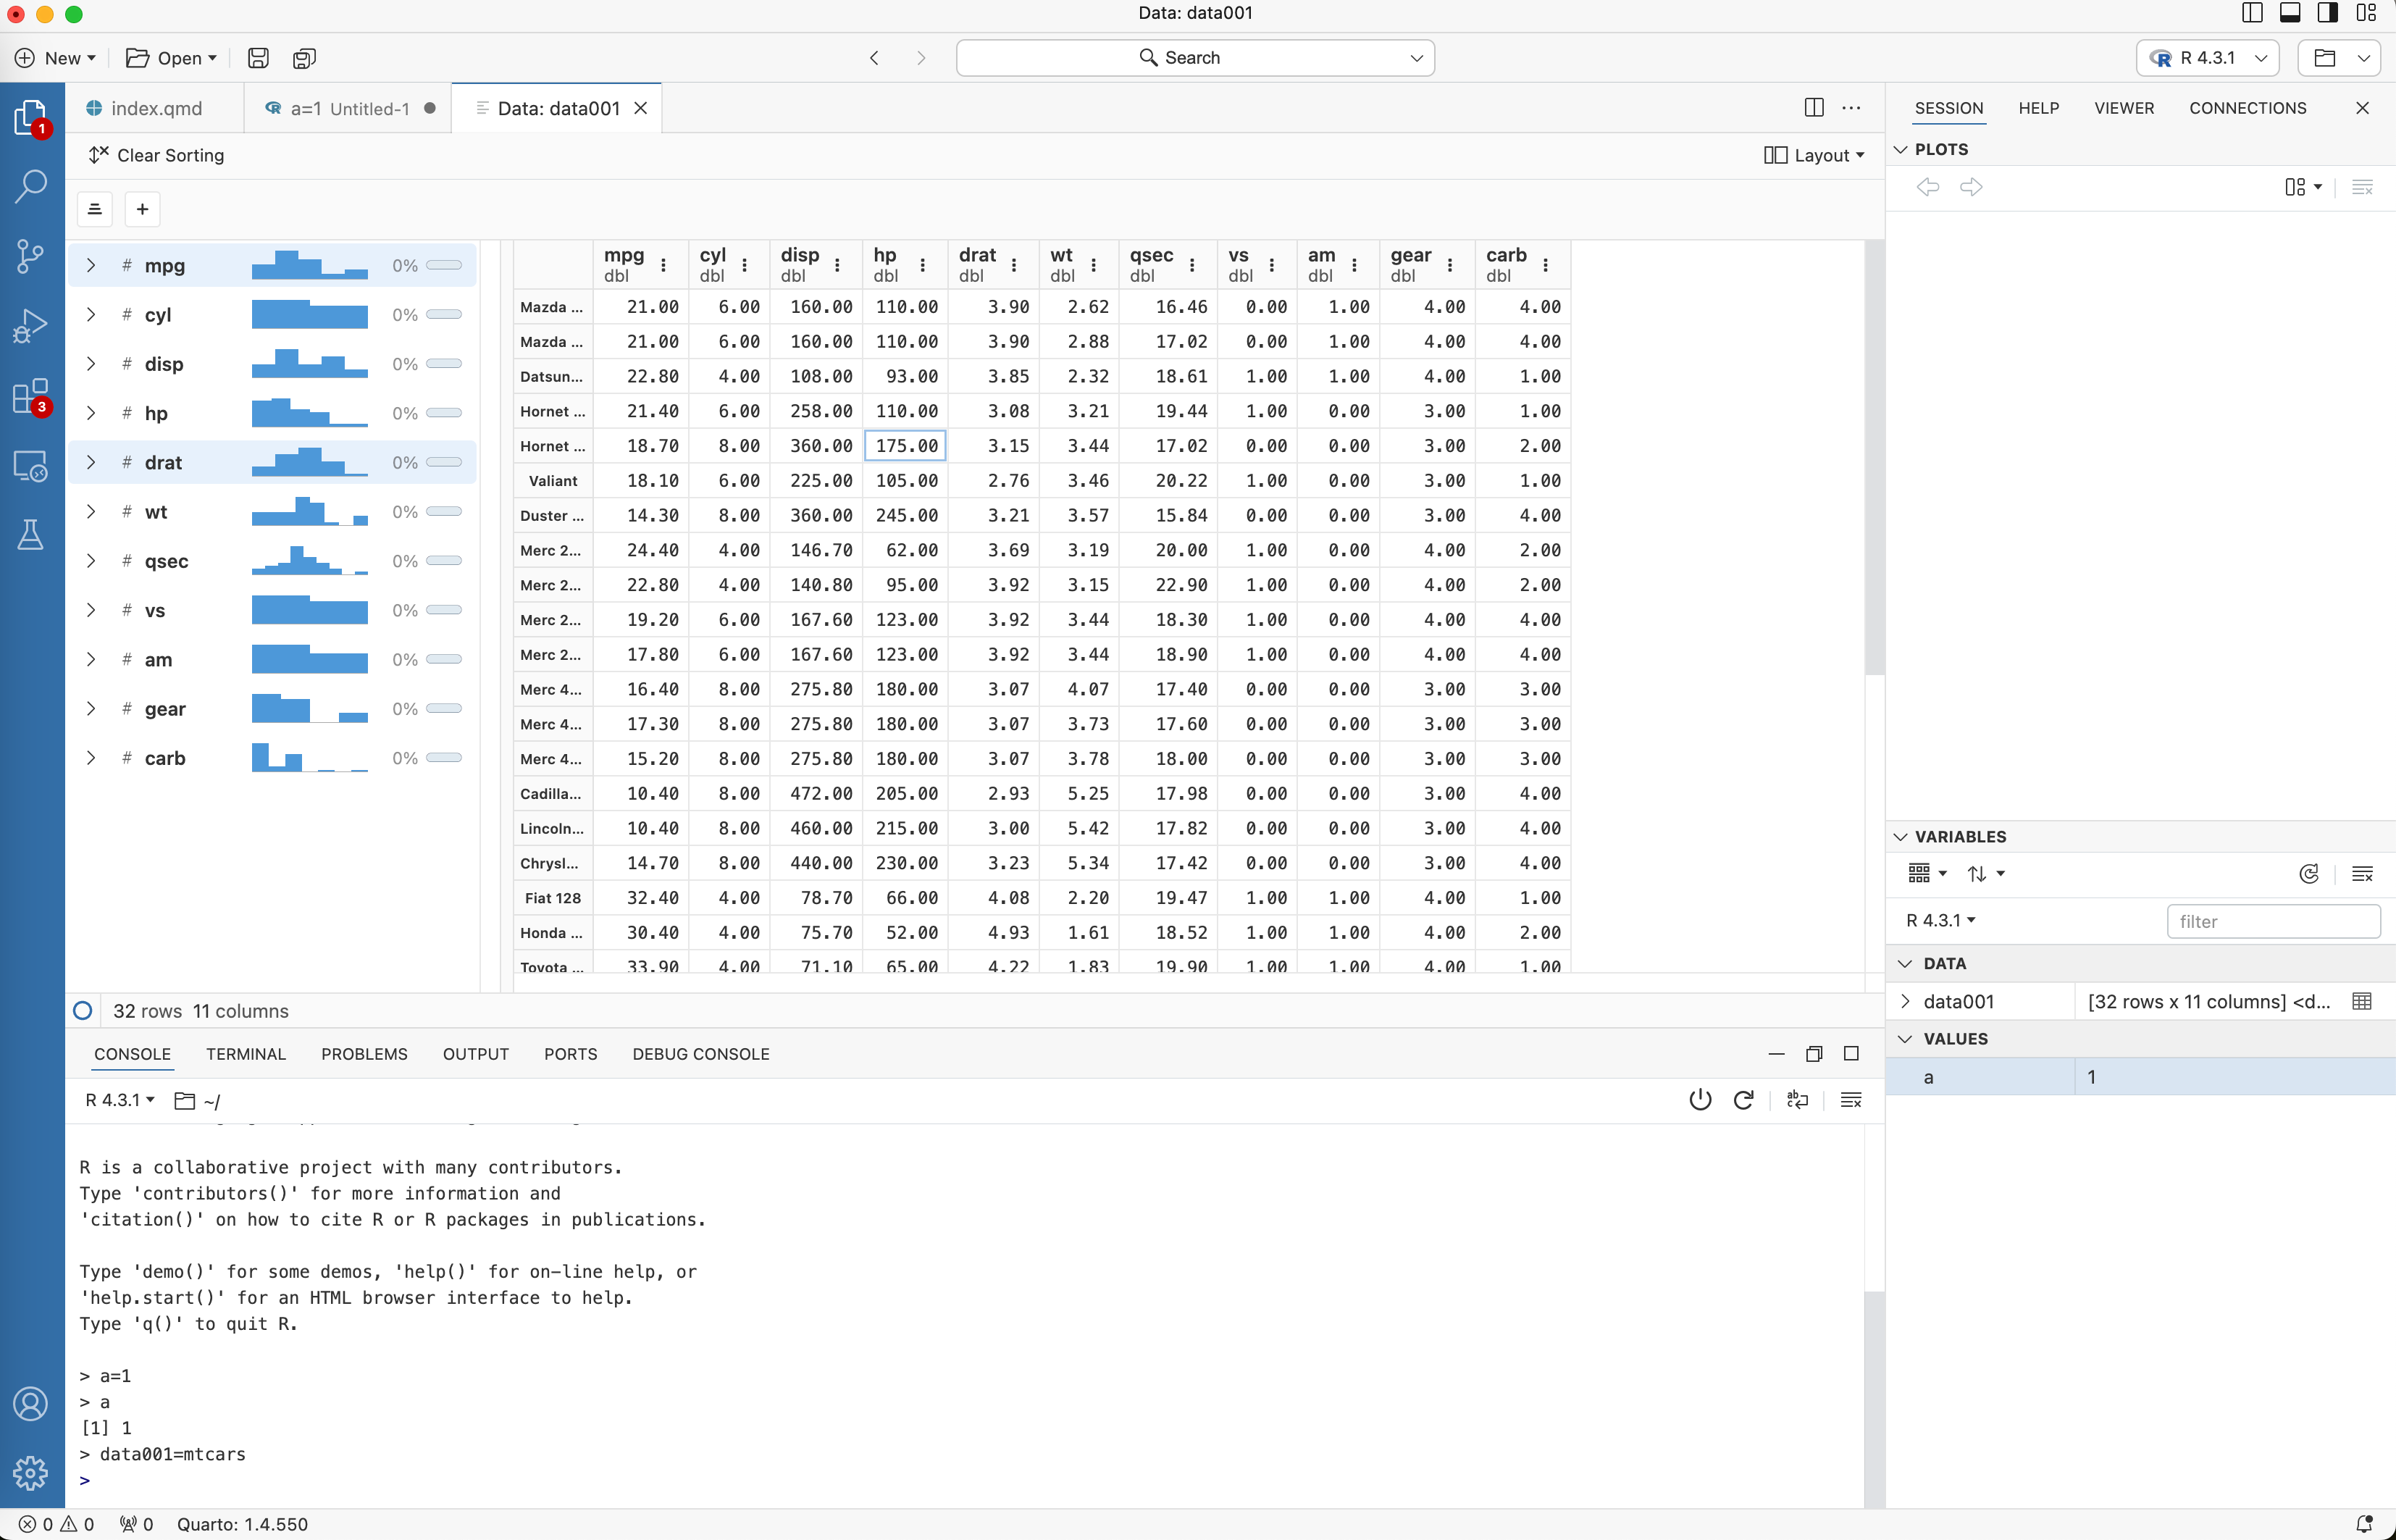
https://github.com/posit-dev/positron
Link:https://reg.conf.posit.co/flow/posit/positconf24/publiccatalog/page/publiccatalog/session/1712003957019001aS0p
https://reg.conf.posit.co/flow/posit/positconf24/publiccatalog/page/publiccatalog?search=&tab.day=20240813