Code
library(ggplot2)
library(tidyverse)library(ggplot2)
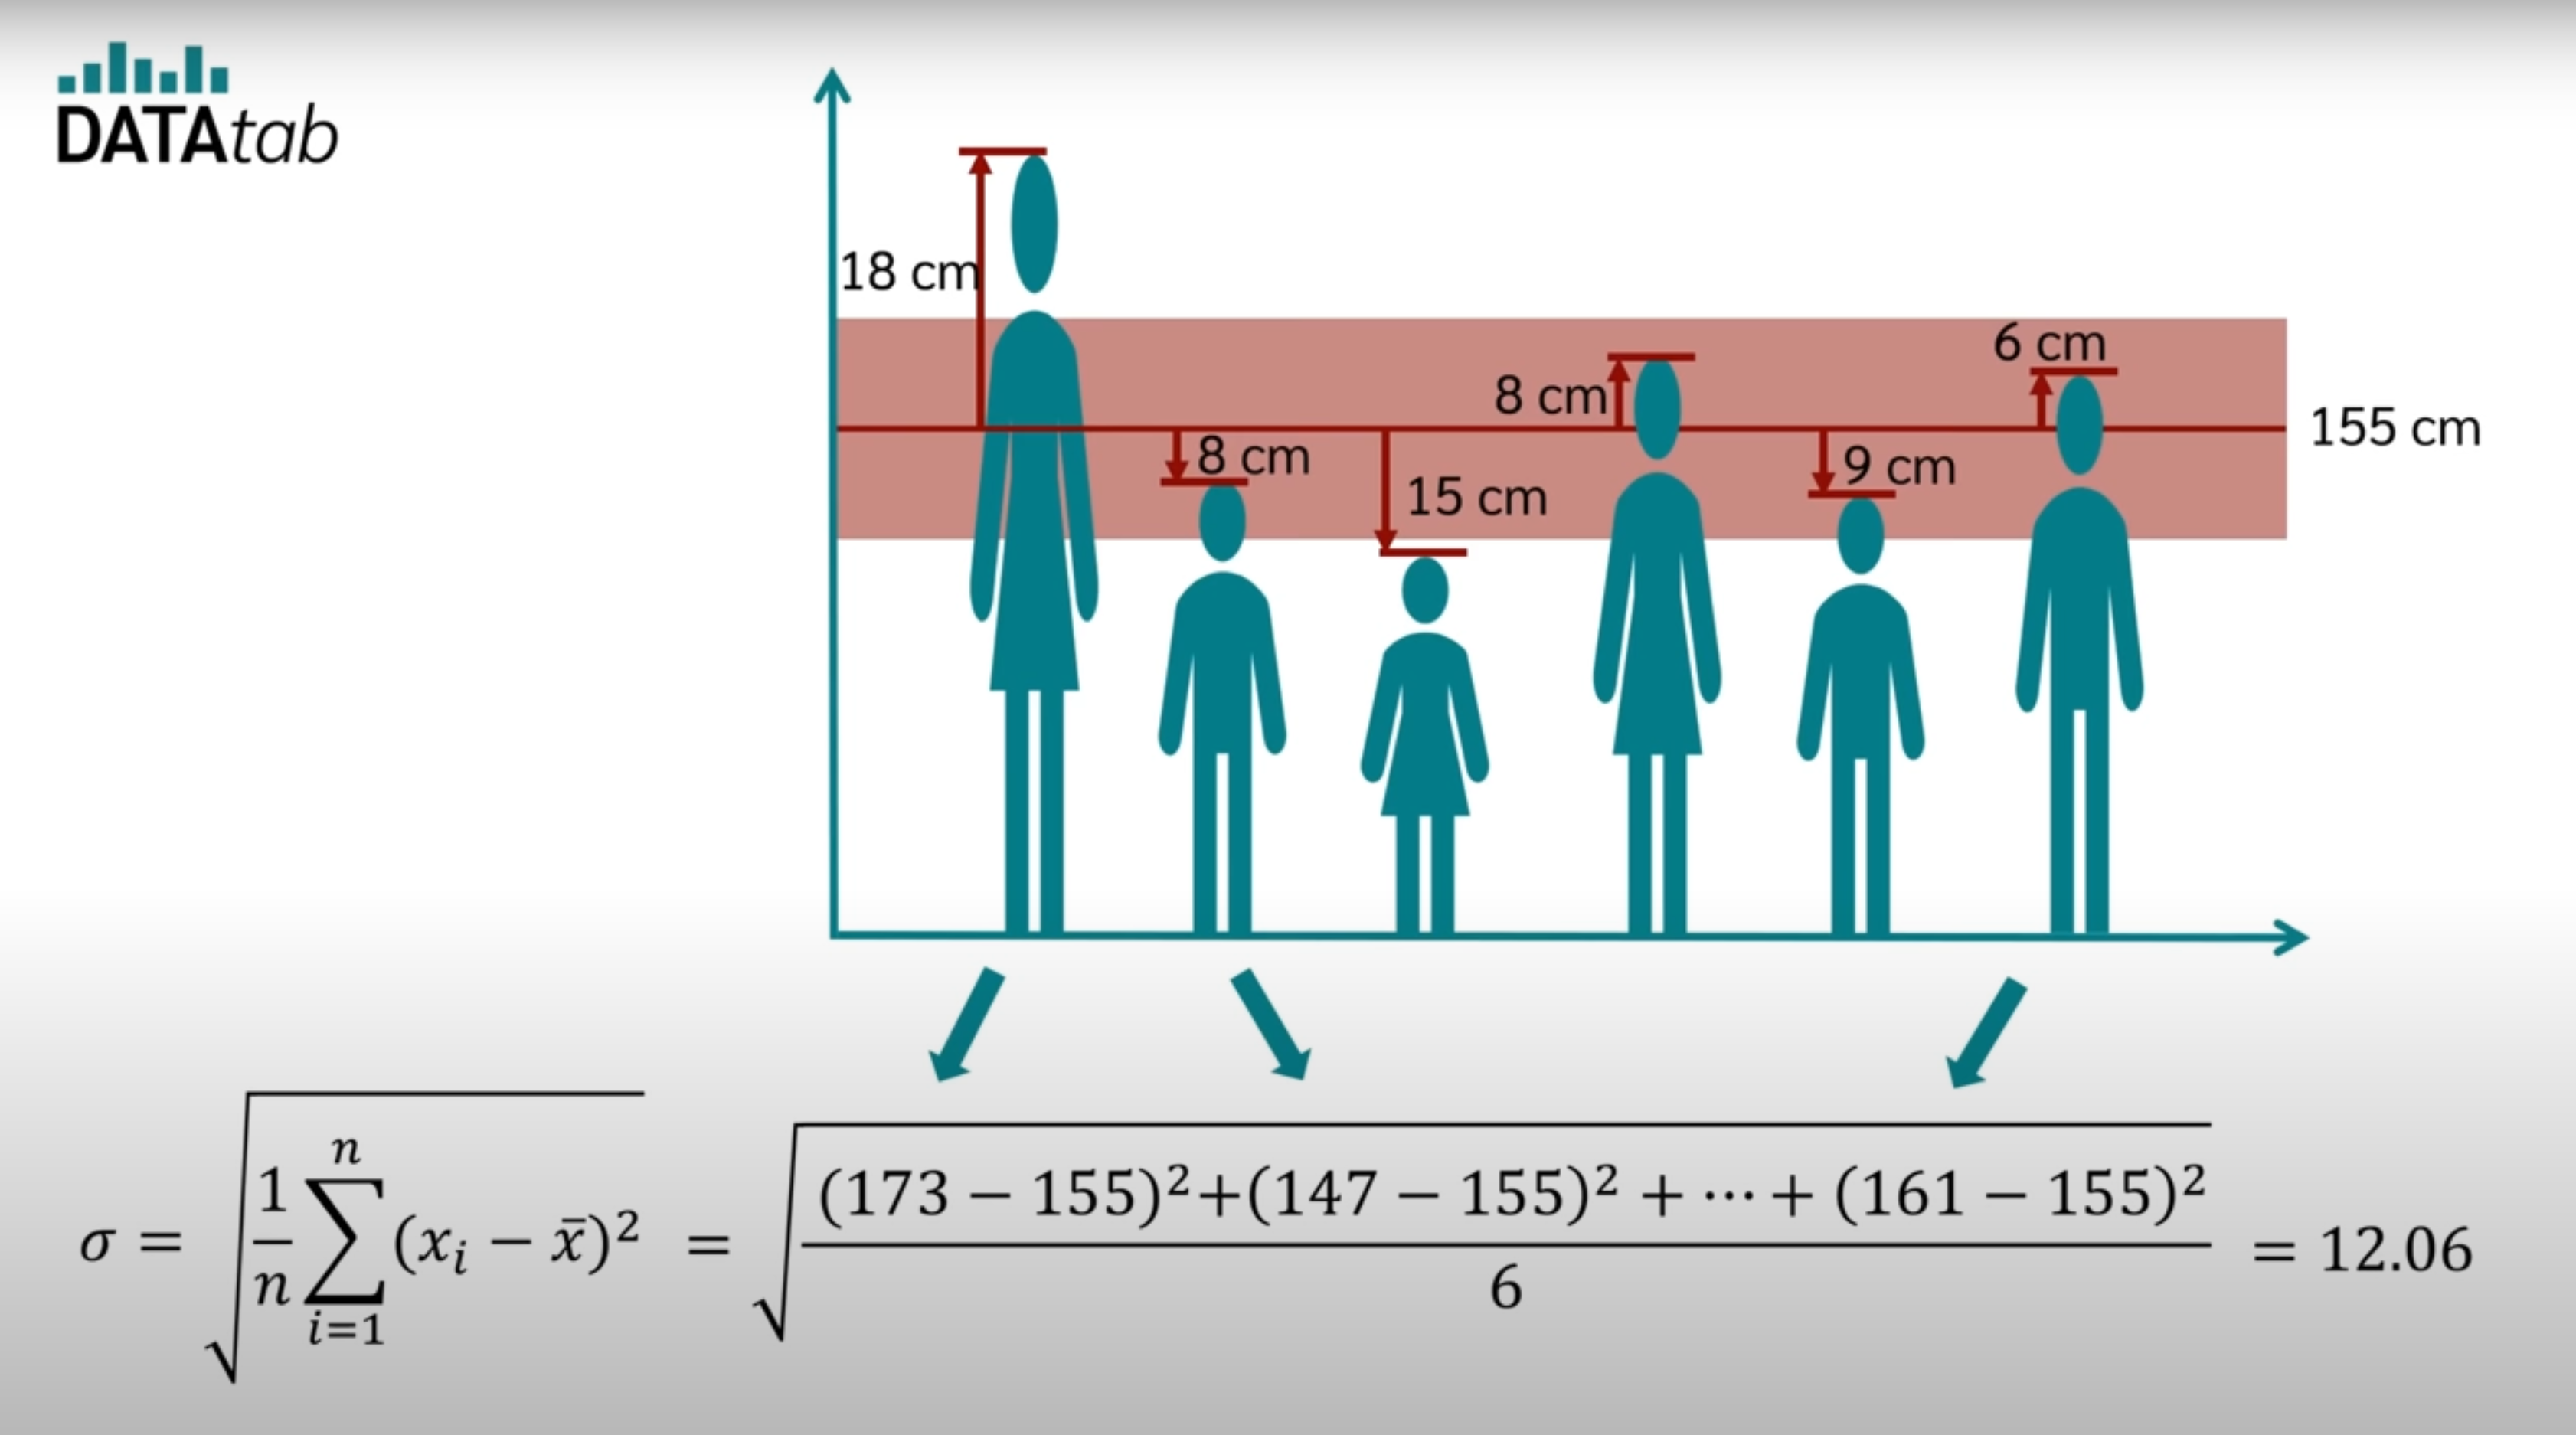
library(tidyverse)mean 0 and standard deviation 1 Normal distribution is call standard normal distribution
create 1000 number from Normal distribution with mean 0 and standard deviation 1
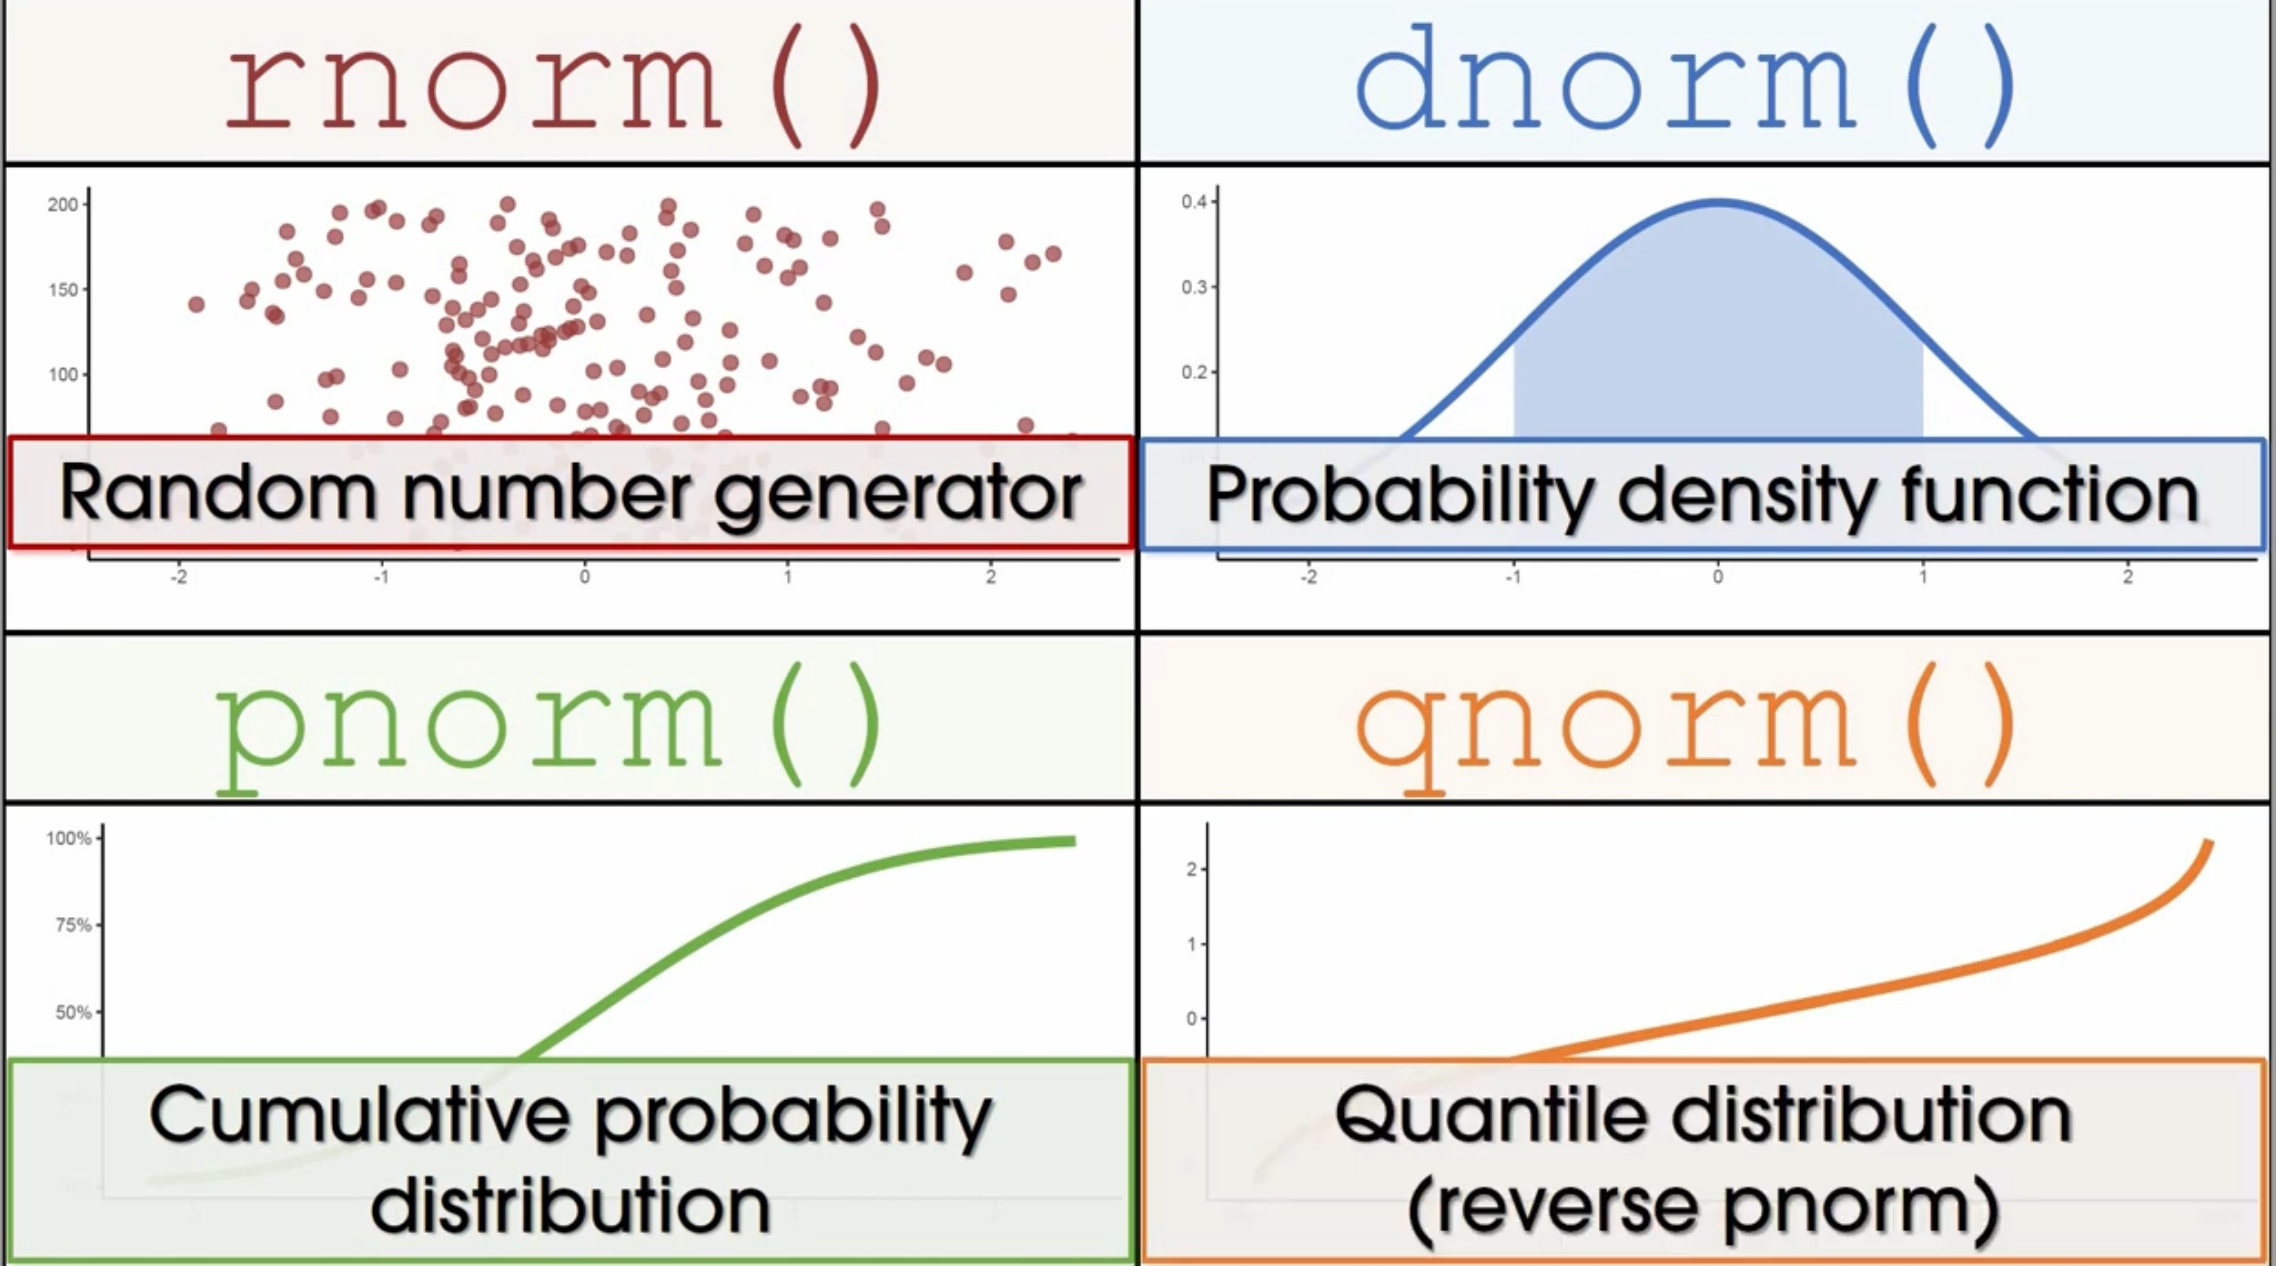
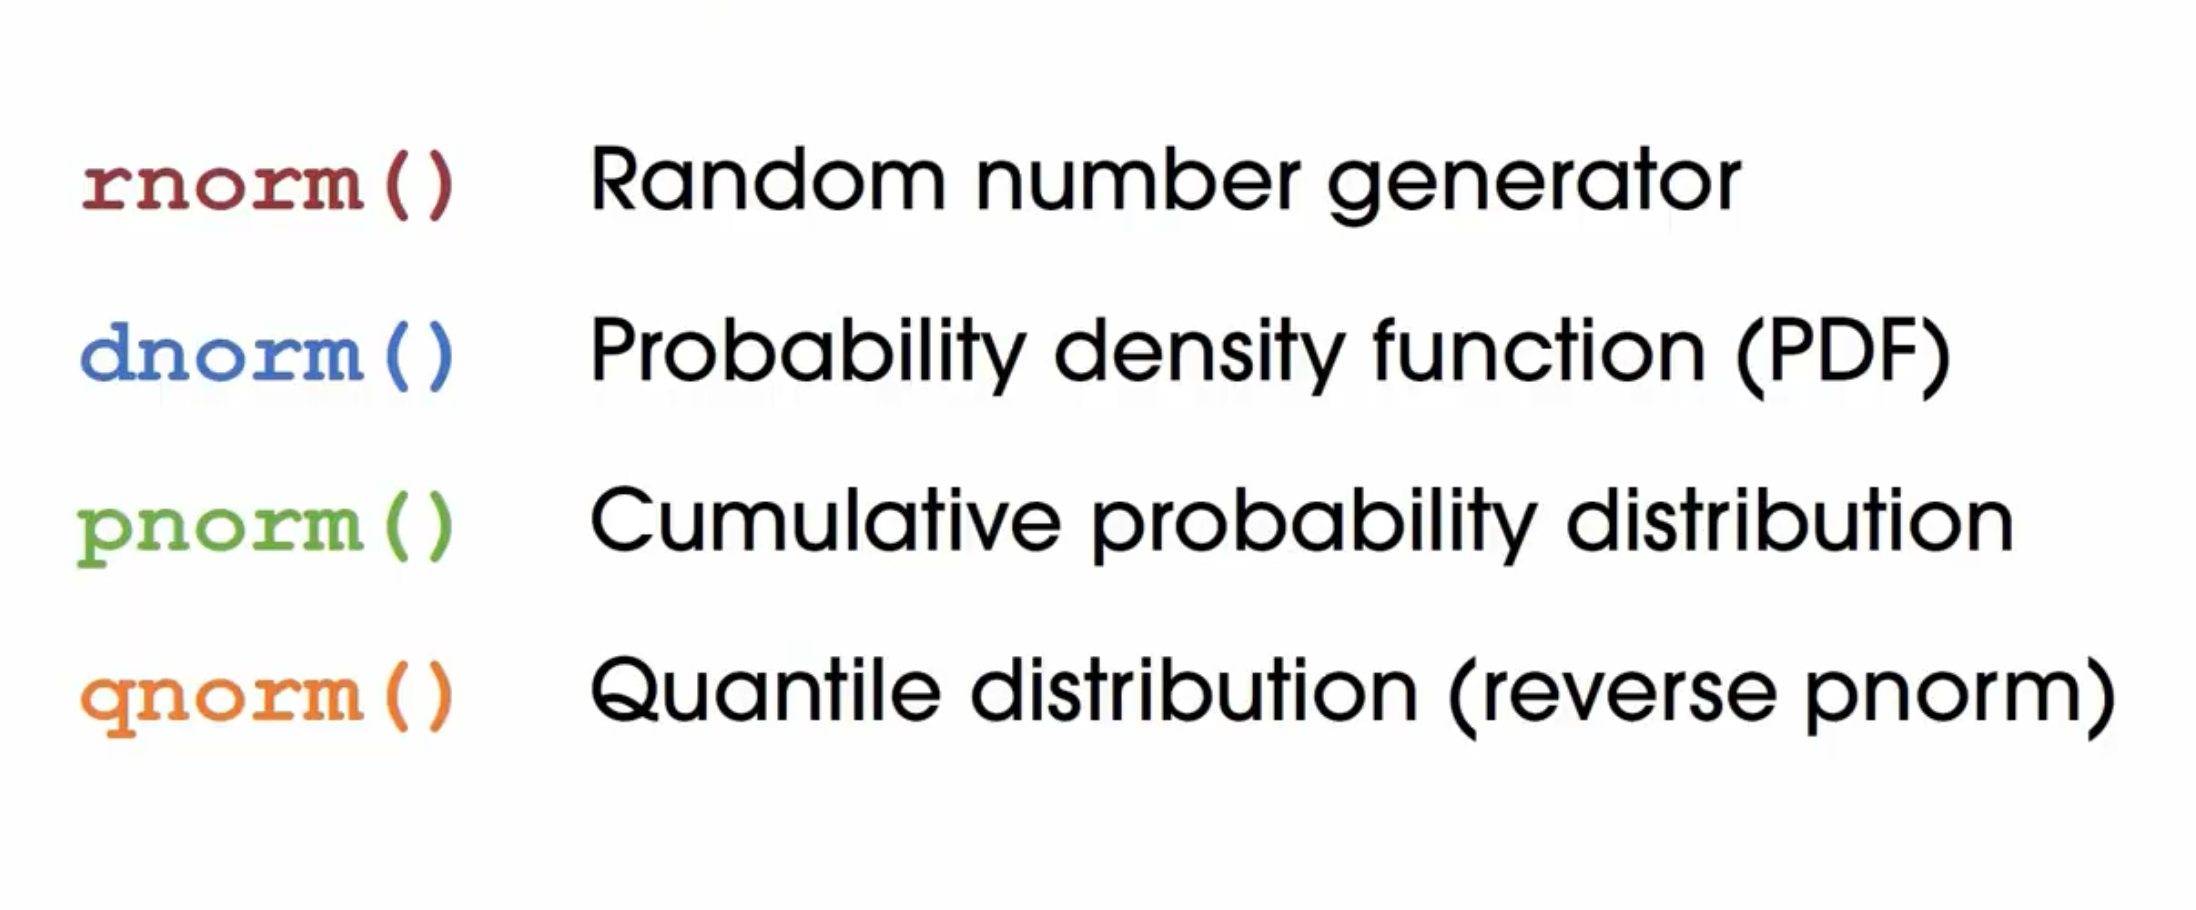
v1= rnorm(1000,mean = 0, sd = 1)
data001=as.data.frame(v1)

ggplot001=ggplot(data001, aes(v1)) + geom_histogram()
ggplot001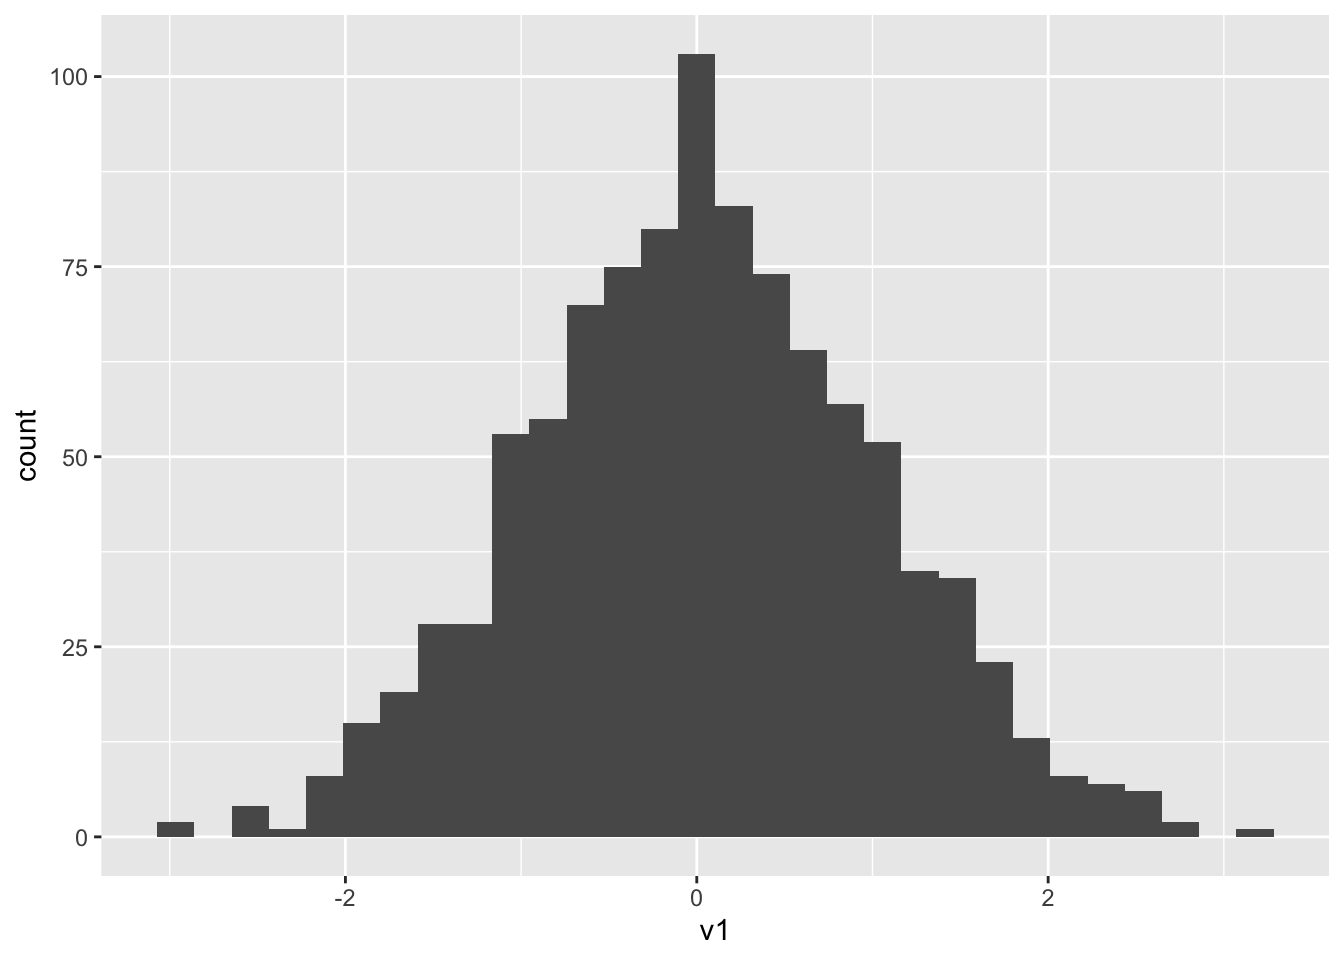
the cumulative probability <1 from Normal distribution with mean 0 and standard deviation 1
v1= pnorm(1,mean = 0, sd = 1)
v1
[1] 0.8413447the number from cumulative probability<0.8413447 from Normal distribution with mean 0 and standard deviation 1
v1= qnorm(0.8413447,mean = 0, sd = 1)
v1
[1] 0.9999998
mean = 192.9
sd = 7.1#less than 200
v1= 1-pnorm(200,mean = mean, sd = sd)
v1[1] 0.1586553#bigger than 200 is same as less than 200v1= qnorm(0.9,mean = mean, sd = sd)
v1[1] 201.999v1= rnorm(500,mean = mean, sd = sd)
data001=as.data.frame(v1)
ggplot001=ggplot(data001, aes(v1)) + geom_histogram()
ggplot001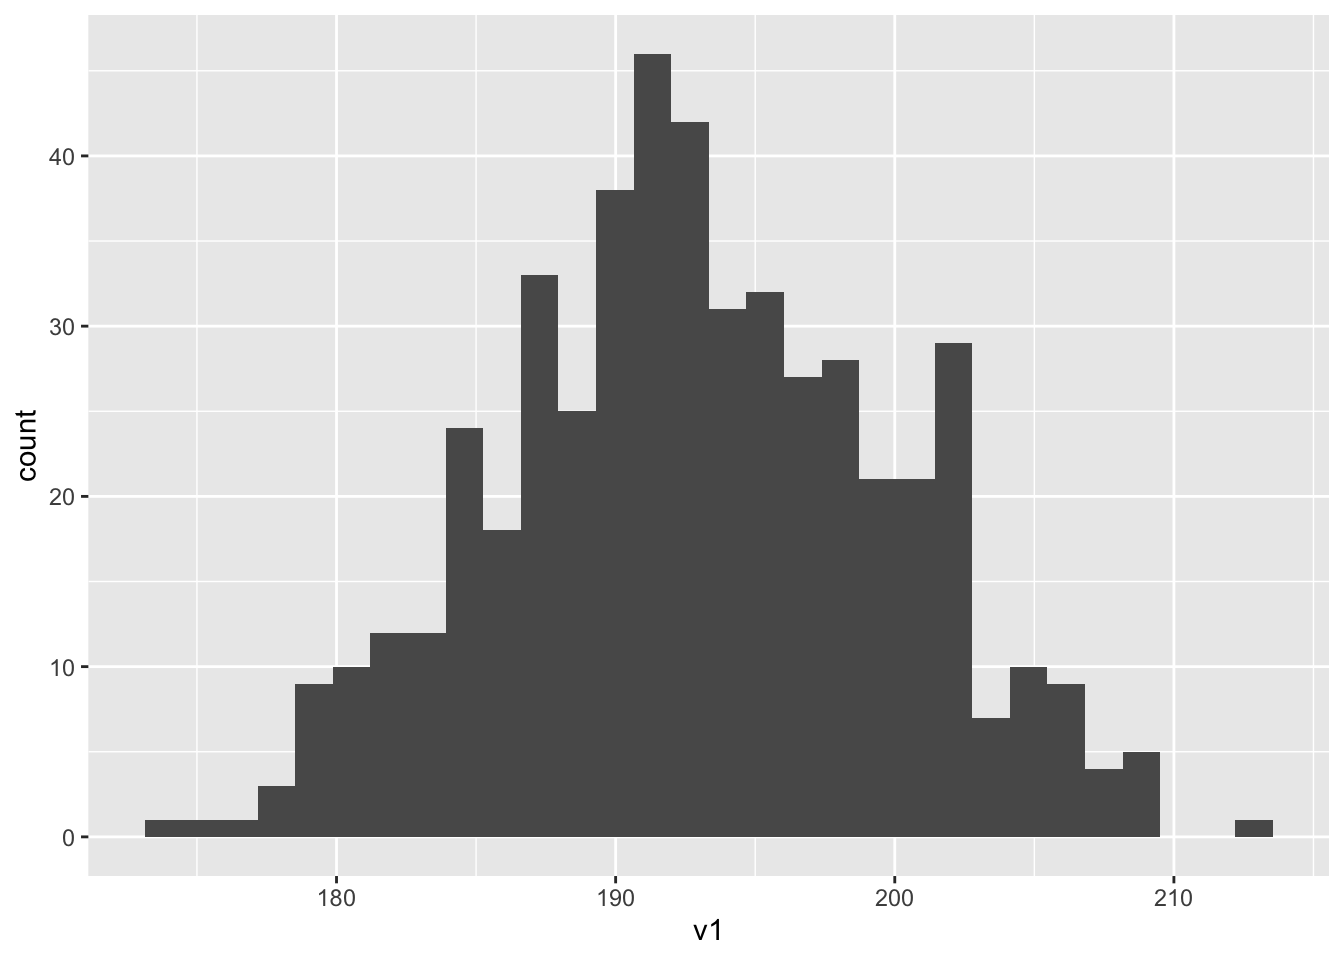
https://www.youtube.com/watch?v=esskJJF8pCc
https://www.youtube.com/watch?v=q8baE17TAiU
https://www.youtube.com/watch?v=X5NXDK6AVtU